
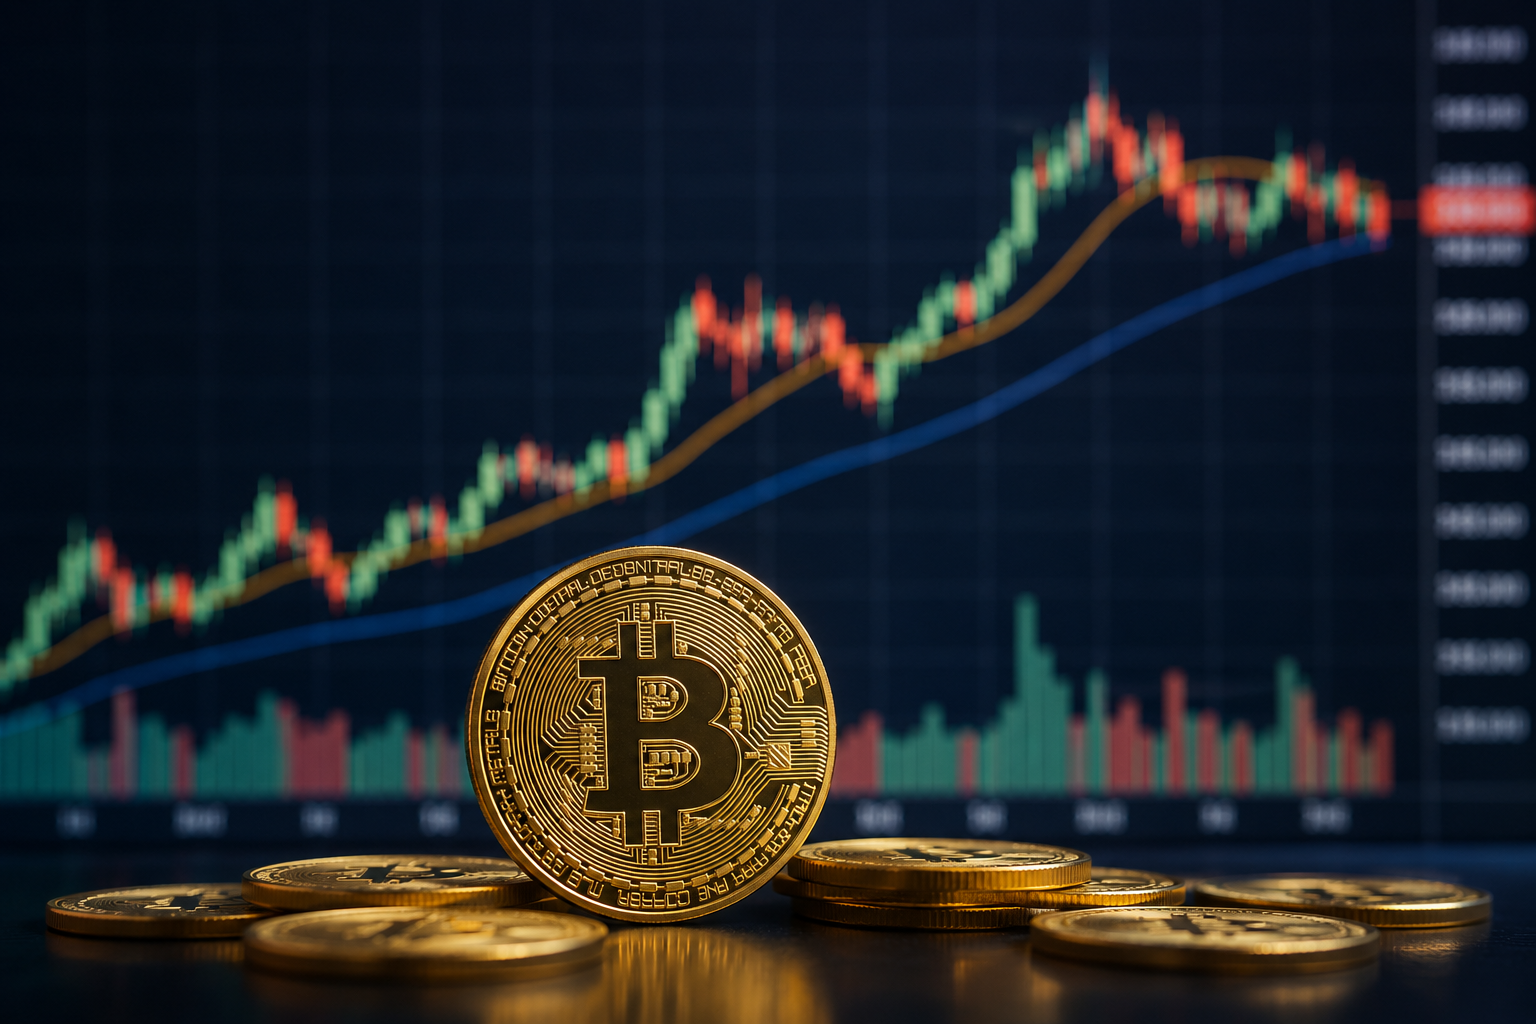
Price action remains weak and institutions are cautious, but signs of accumulation are emerging beneath the surface
Bitcoin is going through one of its most complex and interesting periods in recent years.
On one side, the price has fallen by roughly half from its 2025 peak, U.S. spot ETFs are experiencing unstable flows, institutional investors have reduced risk and some long-term holders are realizing losses.
On the other side, Bitcoin continues to trade above the important $60,000 region, large buyers are placing bids below the market, public companies are still accumulating coins and the derivatives market has already undergone a substantial reduction in leverage.
This is not a simple market in which every participant is trying to escape. It is a struggle between sellers who are forced or willing to reduce exposure and buyers who believe current prices offer long-term value.
The key question is not simply whether Bitcoin will rise or fall next week. The more important question is whether the market is approaching the final stage of a bottoming process or merely pausing within a bear trend that has not yet ended.
The Current Picture: From Record Highs to a Value Zone
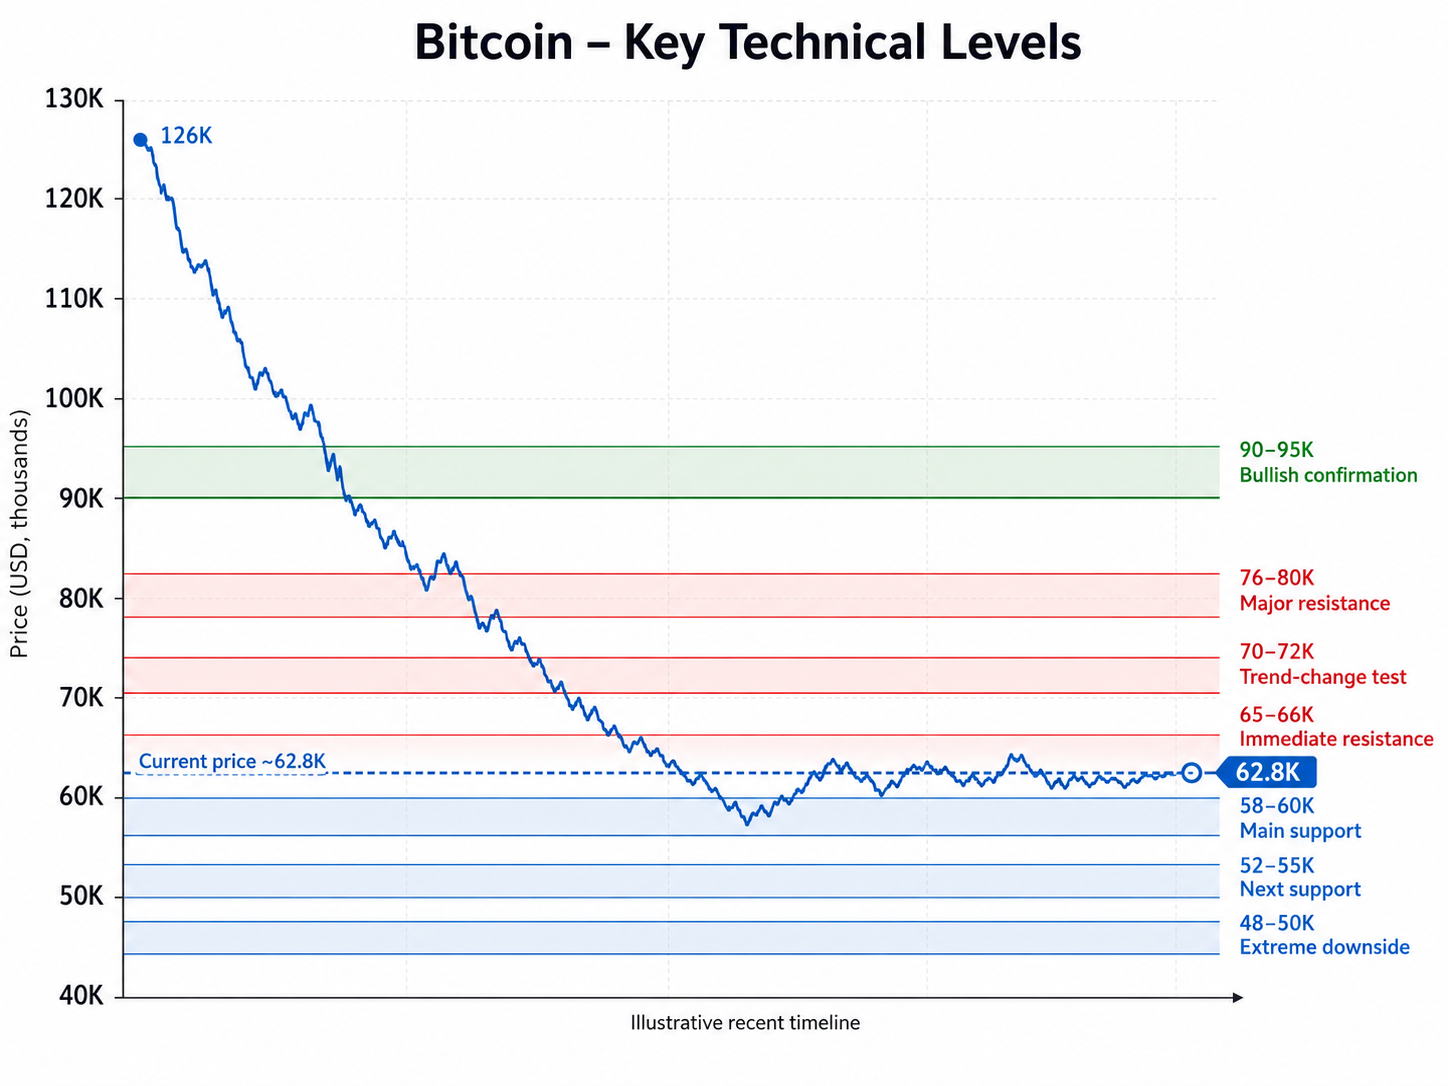
Bitcoin currently trades near $62,000–$63,000 after reaching more than $126,000 during the past 52 weeks. The decline of approximately 50% has returned the asset to levels last seen before the final stage of the previous rally.
Glassnode reports that Bitcoin has spent approximately five months below both the Short-Term Holder Cost Basis and the True Market Mean.
Historically, extended periods below these levels indicate a weak market, but they can also signal that price is moving into a zone offering more attractive future returns. Glassnode describes the current environment as a bottom-building process while emphasizing that the process is not yet complete.
Who Is Selling Bitcoin?
1. ETFs and Institutional Investors
U.S. spot ETFs have been one of the main sources of selling pressure.
Digital-asset investment products recorded three consecutive weeks of outflows through early June. During the week ending June 1, investors withdrew approximately $1.67 billion, including roughly $1.44 billion from Bitcoin-focused products. Three-week cumulative outflows reached approximately $4.21 billion.
Flows improved on several days in early July but remained unstable. U.S. spot Bitcoin ETFs recorded approximately $296 million of net outflows on July 1, followed by inflows of about $223.5 million on July 2 and $265.7 million on July 6.
Institutions have therefore not abandoned Bitcoin, but they have not returned as consistent buyers either. Their decisions remain sensitive to macroeconomic conditions, Treasury yields, the dollar, oil prices and general risk appetite.
Glassnode also found that daily ETF trading volume declined to roughly $650 million–$950 million, around 80% below the October 2025 peak. This confirms that institutional demand remains weak and has not yet stabilized.
2. Investors Who Bought Near the Highs
A significant part of the pressure comes from short-term holders who purchased Bitcoin at much higher prices.
When the market falls below their cost basis, some investors sell to limit losses, meet collateral requirements or shift into less volatile assets.
These sales do not necessarily reflect a long-term rejection of Bitcoin. They often result from excessive leverage, poor risk management or an investment horizon that was too short.
3. Long-Term Holders Realizing Losses
One of the most important developments is that some long-term holders have also begun realizing losses.
Glassnode reports that long-term holder loss realization reached approximately $280 million per day at one stage, the highest level since December 2022. Long-term holders accounted for roughly 43% of total realized value during the period.
This is negative in the short term, but the context matters. When even experienced holders begin to capitulate, the market may be moving toward an advanced stage of seller exhaustion. Coins move from weaker owners into the hands of investors with longer time horizons.
Capitulation, however, does not guarantee that the low is already in. It can continue for weeks or months.
4. Bitcoin Miners
Miners remain another potential source of supply, particularly as profitability declines.
Global Bitcoin hashrate fell approximately 5.8% during the second quarter of 2026, from about 1,066 EH/s in the first quarter to 1,004 EH/s. The decline was attributed to lower Bitcoin prices and mining revenue falling toward record lows. An estimated 252 EH/s of older equipment went offline because it could no longer cover operating costs.
Miners with weak balance sheets may be forced to sell Bitcoin to pay for electricity, financing and equipment. Lower prices can therefore create a cycle in which declining profitability generates additional selling.
Over the longer term, however, the removal of inefficient miners can strengthen the industry by shifting activity toward operators with cheaper power and stronger balance sheets.
Who Is Buying?
1. Institutional Buyers Providing Bids Below the Market
Despite ETF outflows, Coinbase’s order book has recently shifted heavily toward the bid side. According to Glassnode, institutions and large investors have been placing buy orders below the market and providing liquidity during declines.
This is not yet aggressive demand chasing the price higher. These are patient buyers who will not pay any price but are willing to absorb supply when Bitcoin reaches their valuation zones.
The distinction matters. Strong bull markets are often characterized by buyers chasing price. Bottom-building markets are frequently characterized by buyers waiting for sellers to come to them.
2. Bitcoin Treasury Companies
Public companies remain an important source of demand even after the decline.
Strategy, the world’s largest Bitcoin treasury company, reports holdings of more than 845,000 Bitcoin. The company continues to use equity, preferred stock and credit instruments to increase its holdings and says it views Bitcoin as a long-term asset that it intends to continue accumulating depending on market and financing conditions.
Other companies are also buying. Strive reported purchasing 6,236 Bitcoin during the second quarter at an average price of approximately $74,290. As of June 30, it held 19,864 Bitcoin at an overall average cost of about $94,761, well above the current market price.
This illustrates two important points. Treasury companies continue to believe in Bitcoin even while carrying accounting losses. However, their purchasing power depends on access to equity and credit markets.
Demand from treasury companies is therefore influenced not only by Bitcoin’s price but also by their stock valuations, premiums to net asset value and ability to raise capital.
3. Long-Term Investors and Value Buyers
Glassnode is seeing early evidence that patient holders are beginning to absorb the coins being sold.
The accumulation is not yet broad or strong enough to confirm a new bull market, but the ownership structure is starting to improve. Supply is gradually transferring from late-cycle buyers selling at losses to investors willing to hold for longer periods.
This is often the stage when a market appears weak on the surface while the quality of ownership improves underneath.
Derivatives: Leverage Is Returning Before Spot Demand
The derivatives market is critical for understanding short-term risk.
Total crypto open interest stands above $108 billion, while the long-to-short ratio is close to balanced. Glassnode also notes that leveraged traders have recently increased long exposure even though spot and institutional demand remain weak.
This creates a fragile structure.
When price rises on leverage without meaningful spot buying, the move can be fast but unstable. A modest decline can trigger liquidations, creating forced selling and accelerating the move downward.
Conversely, a break above resistance while traders hold significant short positions could trigger a short squeeze and push Bitcoin sharply higher.
The current structure therefore points to elevated volatility in both directions rather than a calm, gradual trend.
Technical Analysis: $60,000 Is the Main Defensive Line
Technically, Bitcoin remains in a long-term downtrend from its record high, but it is attempting to build a base between approximately $58,000 and $65,000.
Support Levels
$58,000–$60,000: The most important support area. Bitcoin has already moved below $60,000 and recovered. As long as this region holds on a weekly closing basis, a bottoming attempt remains possible.
$52,000–$55,000: The next support area if the current floor fails. A decline toward this zone would indicate that the bottoming structure has weakened.
$48,000–$50,000: A more extreme downside scenario that could become relevant following a major macro shock, renewed ETF outflows or a broad leverage liquidation.
Resistance Levels
$65,000–$66,000: Immediate resistance. A breakout would show that buyers are beginning to push price beyond the current consolidation.
$70,000–$72,000: The first major test of a trend reversal. As long as Bitcoin remains below this area, rallies may still be corrective moves inside a broader downtrend.
$76,000–$80,000: A major supply area where investors who bought previous declines may use a recovery to exit near break-even.
$90,000–$95,000: Only a sustained recovery above this region would provide stronger confirmation that the larger downtrend has ended.
What Is Needed to Confirm a Bottom?
Four developments would make the bullish case more convincing.
First, spot ETFs must return to a consistent sequence of net inflows rather than occasional positive days between periods of selling.
Second, spot trading volume must increase. A rally without volume does not demonstrate broad demand.
Third, Bitcoin must break above $70,000–$72,000 and eventually turn that area into support.
Fourth, the recovery should occur with controlled leverage. If open interest rises much faster than price, liquidation risk will remain elevated.
The Macroeconomic Environment
Despite the “digital gold” narrative, Bitcoin continues to behave primarily as a risk asset over shorter periods.
When inflation rises, the Federal Reserve remains restrictive, Treasury yields climb and the dollar strengthens, Bitcoin usually comes under pressure. When markets begin pricing lower interest rates and higher liquidity, Bitcoin generally benefits.
Current geopolitical risks and rising oil prices are not automatically bullish for Bitcoin. Initially, they may cause investors to reduce risk, sell volatile assets and favor cash, dollars and short-term government bonds.
Bitcoin may behave more like an alternative monetary asset only if such a crisis develops into a broader loss of confidence in governments, currencies or the traditional financial system.
Three Scenarios
Bullish Scenario
Bitcoin holds the $58,000–$60,000 region, ETF flows turn consistently positive and U.S. inflation moderates.
A break above $66,000 opens the way toward $70,000–$72,000. A sustained move above $72,000 could produce a rally toward $78,000–$80,000 and eventually $90,000.
This scenario becomes more likely if spot volumes rise without a sharp increase in leverage.
Base Scenario
Bitcoin continues consolidating for several weeks or months between $58,000 and $72,000.
ETF flows alternate between positive and negative days, long-term holders continue transferring coins to new buyers and price gradually builds a base.
This can be frustrating for traders but potentially healthy for long-term investors because it allows the market to remove excess leverage and improve the ownership structure.
Bearish Scenario
Bitcoin breaks below $58,000, ETF outflows accelerate and derivatives leverage triggers another liquidation wave.
The next targets would be $52,000–$55,000 and then $48,000–$50,000. Such a decline would place additional pressure on miners, treasury companies and investors who purchased Bitcoin using credit.
Conclusion
Bitcoin remains in a high-risk environment, but its risk-to-reward profile has improved considerably compared with the record-high region.
Institutions are not yet buying aggressively, ETF flows have not stabilized and derivatives show signs that leverage may be returning too early. It is therefore premature to declare that the final low has been established.
Nevertheless, large buyers are beginning to provide bids below the market, public companies continue accumulating and weaker holders are transferring supply to more patient investors. These are common features of a bottom-building process.
For long-term investors, current prices appear more attractive than the peak, but still support a gradual accumulation strategy rather than a single large bet. For traders, the $58,000–$60,000 support zone and $70,000–$72,000 resistance zone are the key boundaries likely to determine the next major move.
Have a take on this?
Jump into the TradeTechAI Discord to discuss this article with other traders.
Written by
Admin User
Editor
Editor at TradeTechAI, covering market analysis, trading strategies, and portfolio insights.