One of the main challenges in technical analysis is distinguishing a genuine market trend from short-term price noise. Traditional candlestick charts display every movement in price, including small fluctuations that may have little practical significance. Heikin Ashi candles are designed to smooth some of that noise and present the direction of the market in a clearer and more consistent way.
The term Heikin Ashi comes from Japanese and can be translated approximately as “average pace” or “average bar.” Unlike traditional candlesticks, where each candle is based directly on the opening, high, low and closing prices of a specific period, Heikin Ashi candles are calculated using a combination of current price data and information from the previous candle. The result is a smoother chart that makes it easier to identify trends, momentum, weakening conditions and possible changes in direction.
On a traditional candlestick chart, the opening price represents the actual price at the beginning of the period, while the closing price represents the final traded price. With Heikin Ashi, the opening and closing values are calculated averages. As a result, a Heikin Ashi candle does not necessarily display the actual price at which the asset opened or closed.
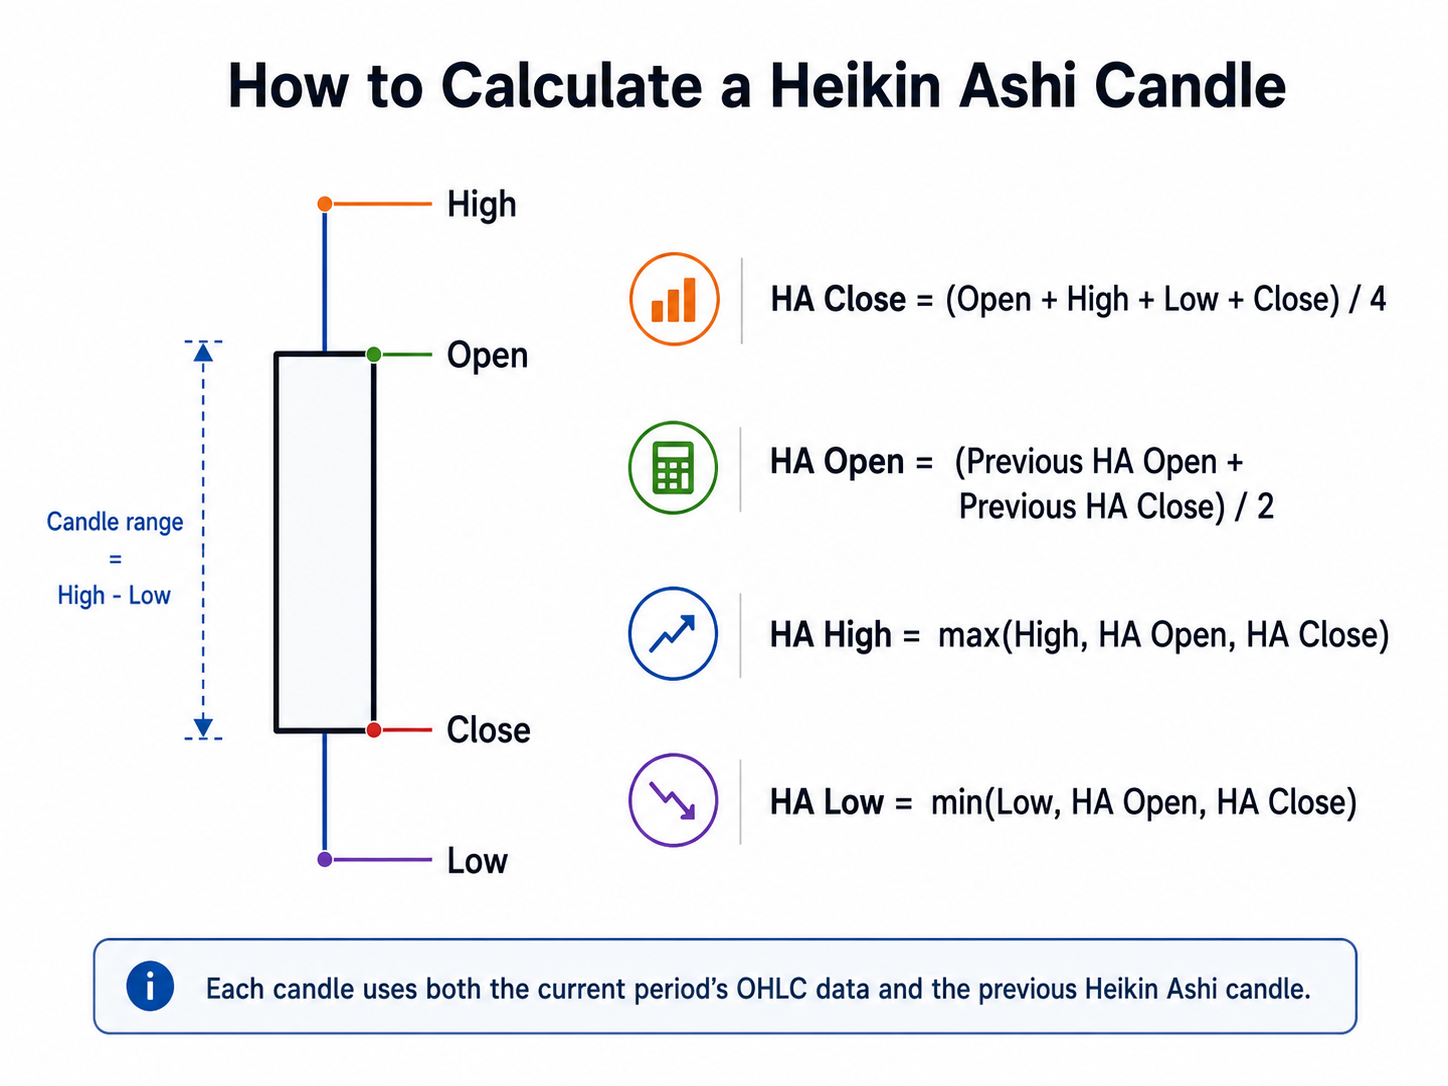
The calculation of a Heikin Ashi candle is based on four values. The closing price is calculated as the average of the current period’s open, high, low and close:
HA Close = Open + High + Low + Close, divided by 4.
The opening price is calculated as the average of the previous Heikin Ashi candle’s open and close:
HA Open = Previous HA Open + Previous HA Close, divided by 2.
The high of the candle is the highest value among the current period’s high, the Heikin Ashi open and the Heikin Ashi close:
HA High = Maximum of High, HA Open and HA Close.
The low is the lowest value among the current period’s low, the Heikin Ashi open and the Heikin Ashi close:
HA Low = Minimum of Low, HA Open and HA Close.
This calculation creates a continuous relationship between each candle and the candle that came before it. Because of this, Heikin Ashi charts react more slowly than traditional candlestick charts, but they often display the overall direction of the market more clearly.
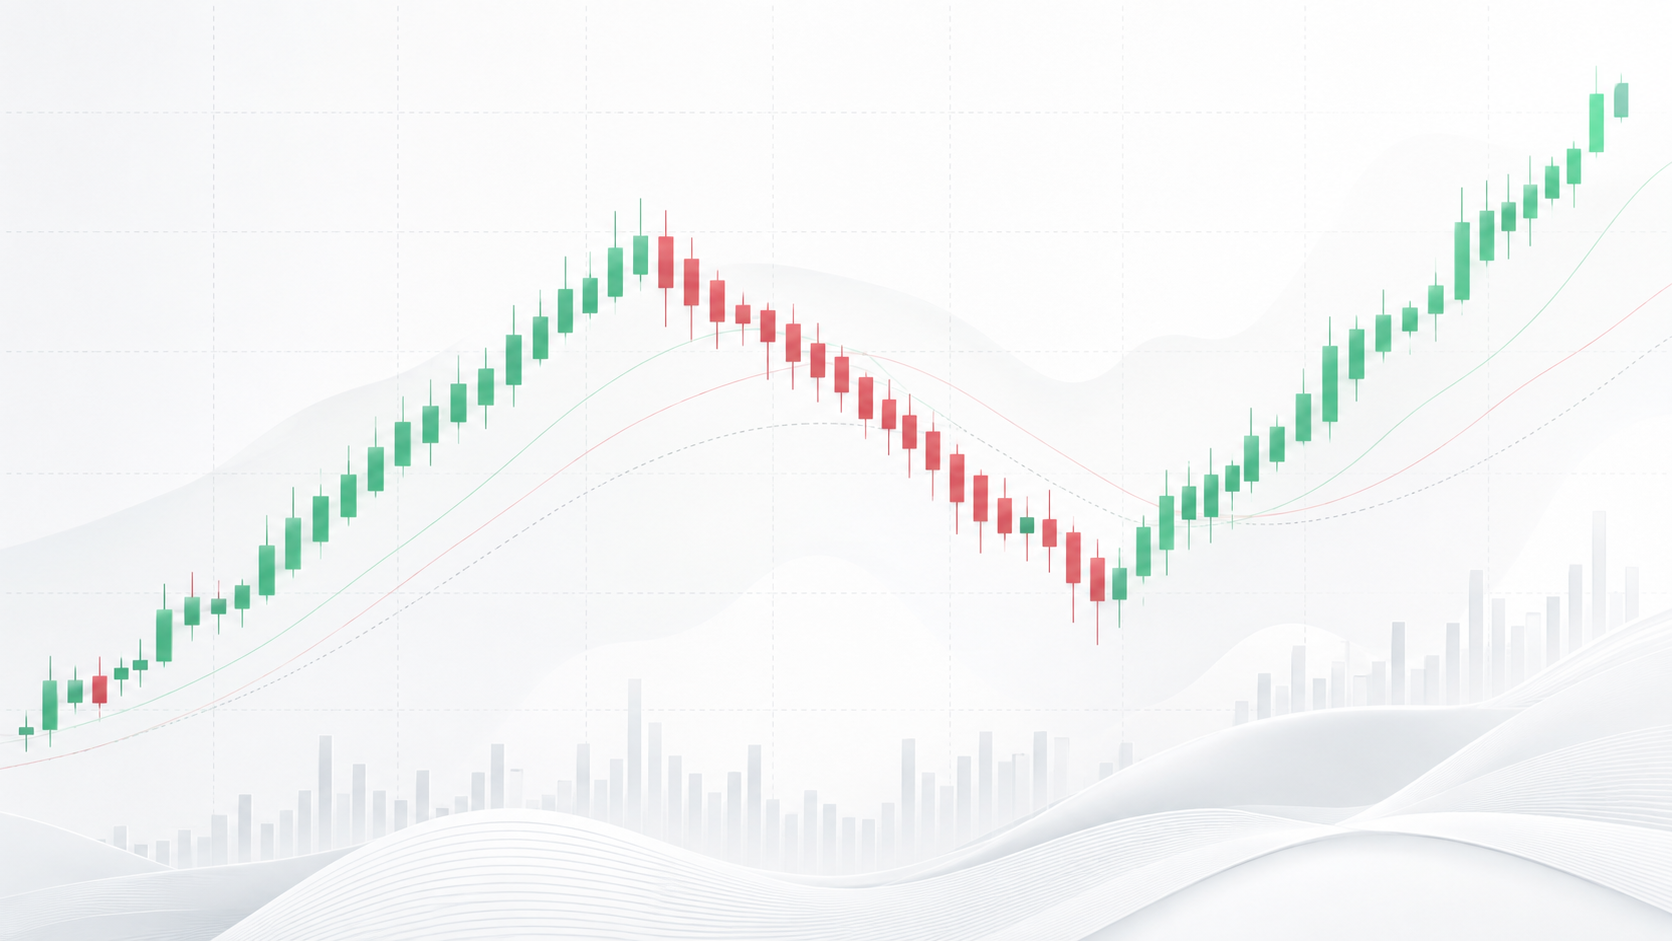
During a strong uptrend, the chart will usually show a sequence of green or light-colored candles with relatively large bodies and very small lower wicks, or no lower wicks at all. This indicates that buyers are in control and sellers are having difficulty pushing the price lower during the period.
In a strong downtrend, the chart will often show a series of red or dark candles with large bodies and very small upper wicks, or no upper wicks. This structure suggests that sellers are dominating the market and that downward pressure remains strong.
Small candles, long wicks on both sides or candles with narrow bodies may indicate uncertainty, slowing momentum or a possible change in trend. Doji-like candles may appear after a long sequence of candles moving in one direction. This does not necessarily represent an immediate reversal signal, but it may warn that the existing trend is losing strength.
The primary use of Heikin Ashi candles is trend identification and trade management. Many traders find it difficult to remain in a profitable position because every small negative candle creates concern that the trend has ended. Heikin Ashi filters some of these minor fluctuations and may help traders remain in a position as long as the candle structure continues to support the prevailing trend.
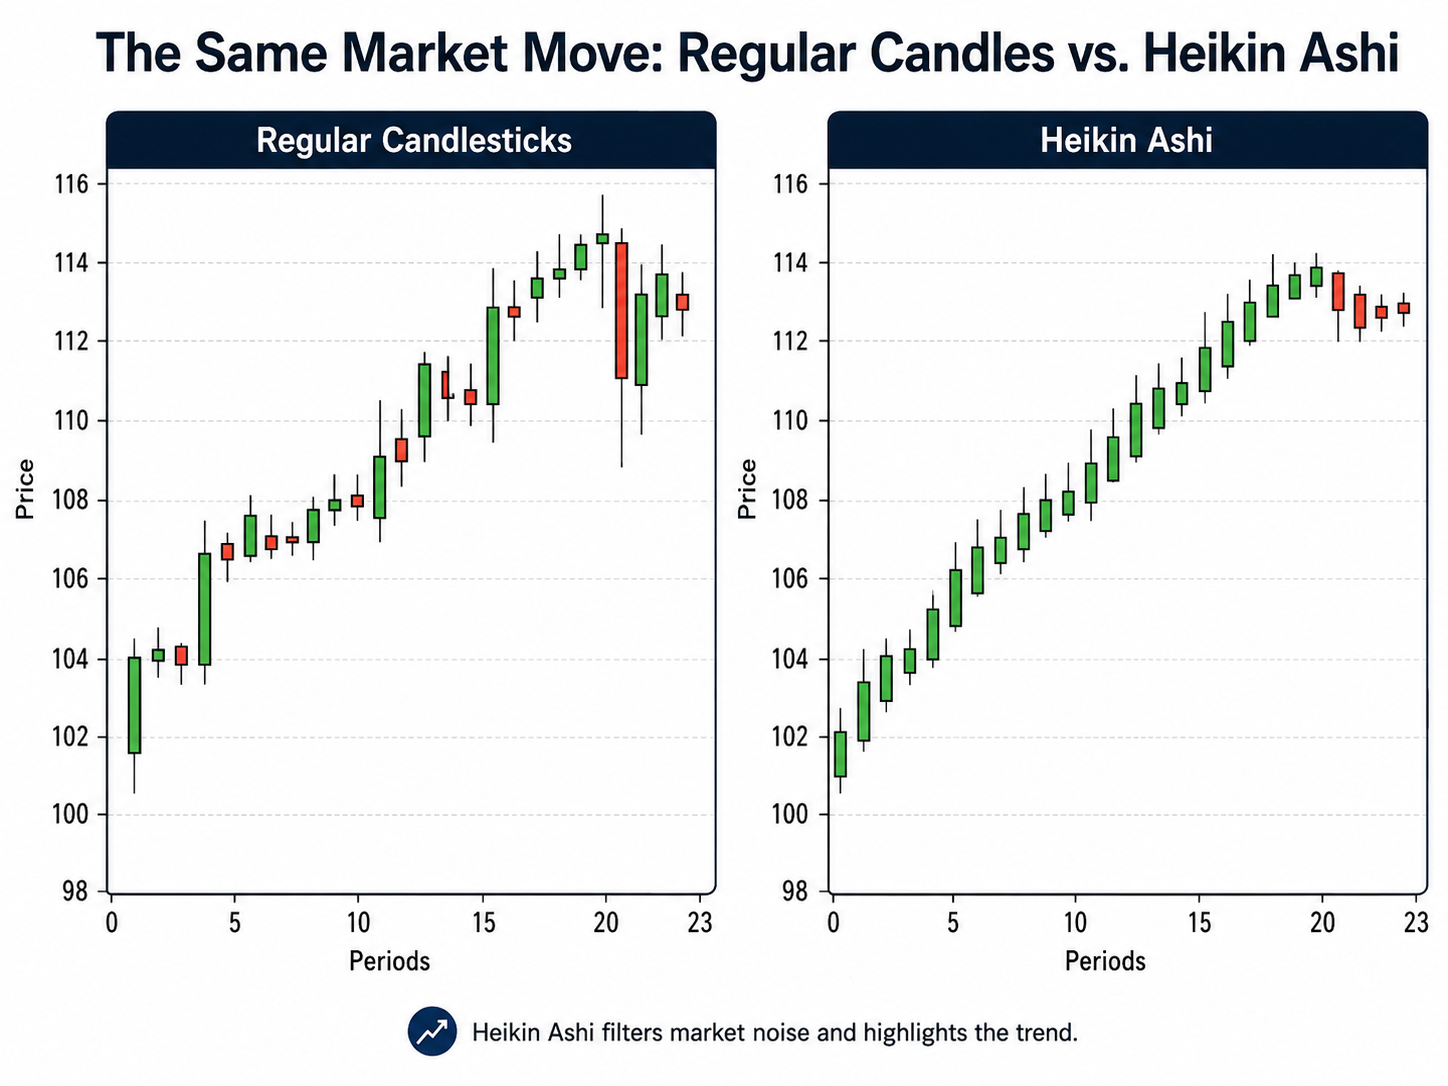
Another important use is measuring trend strength. A sequence of large candles with no wick against the direction of the trend may signal strong momentum. In contrast, the appearance of opposing wicks, smaller candle bodies or frequent color changes may suggest that the trend is weakening.
Heikin Ashi candles can also be used to help manage exits. For example, a trader holding a long position may remain in the trade while strong positive candles continue to appear. A small candle with a meaningful lower wick, followed by a negative candle, may serve as a warning to reduce the position or protect profits.
However, Heikin Ashi candles are generally not ideal for precise order execution. Since the displayed prices are calculated and may differ from actual market prices, traders should verify the real price on a traditional candlestick chart before entering an order, placing a stop-loss or setting a profit target.
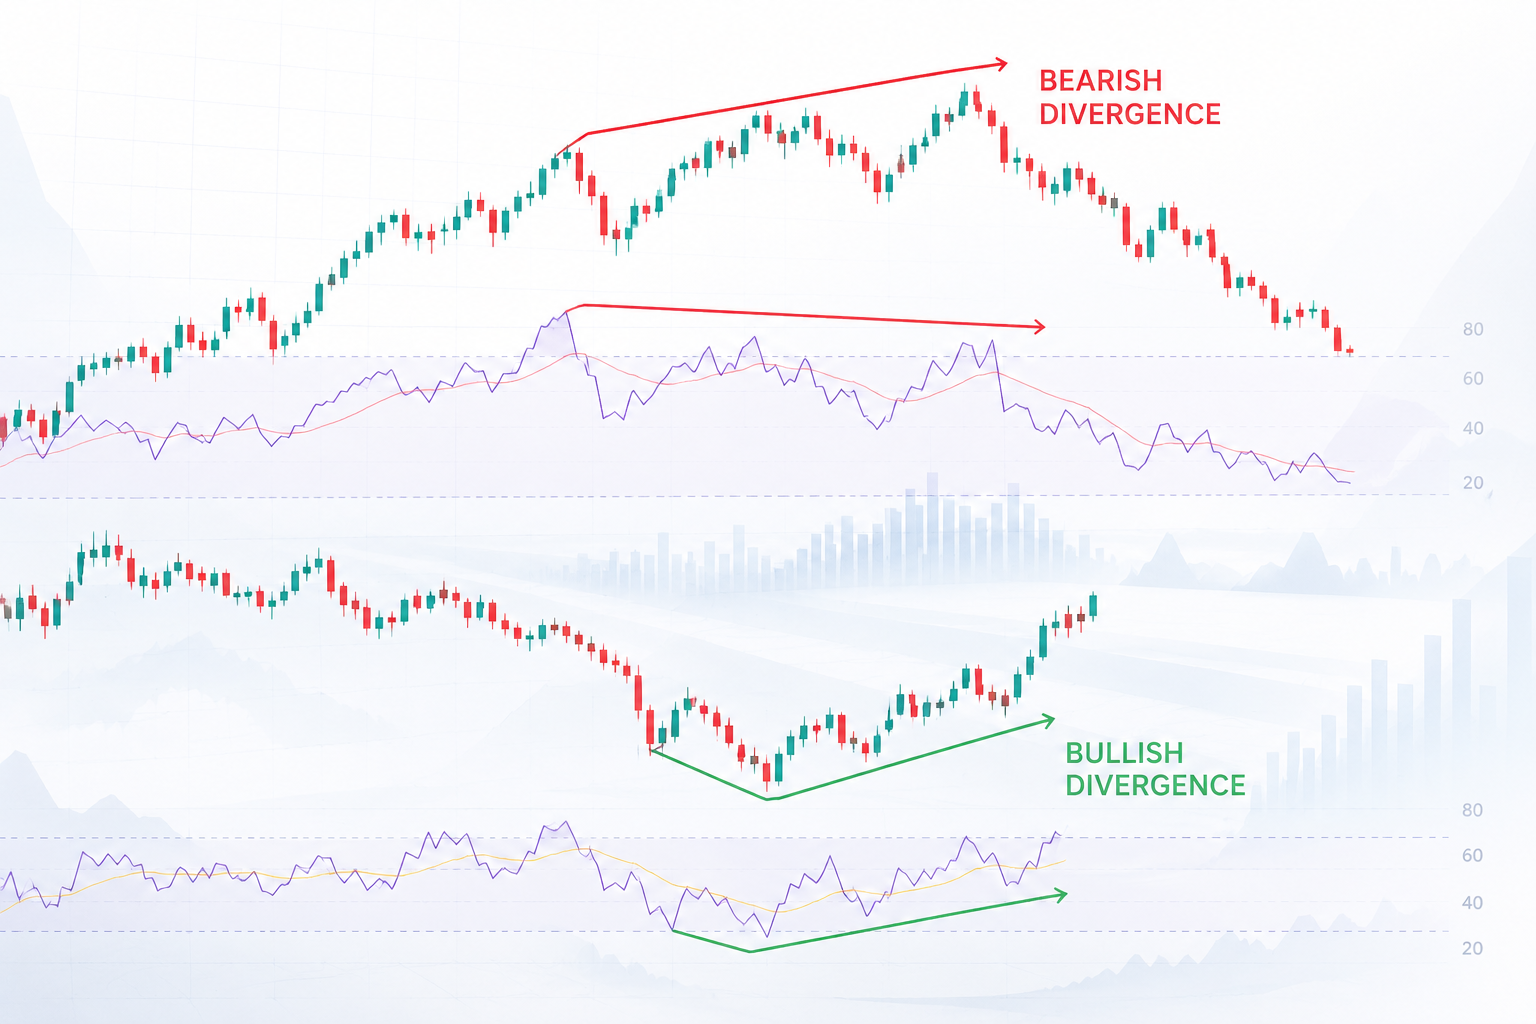
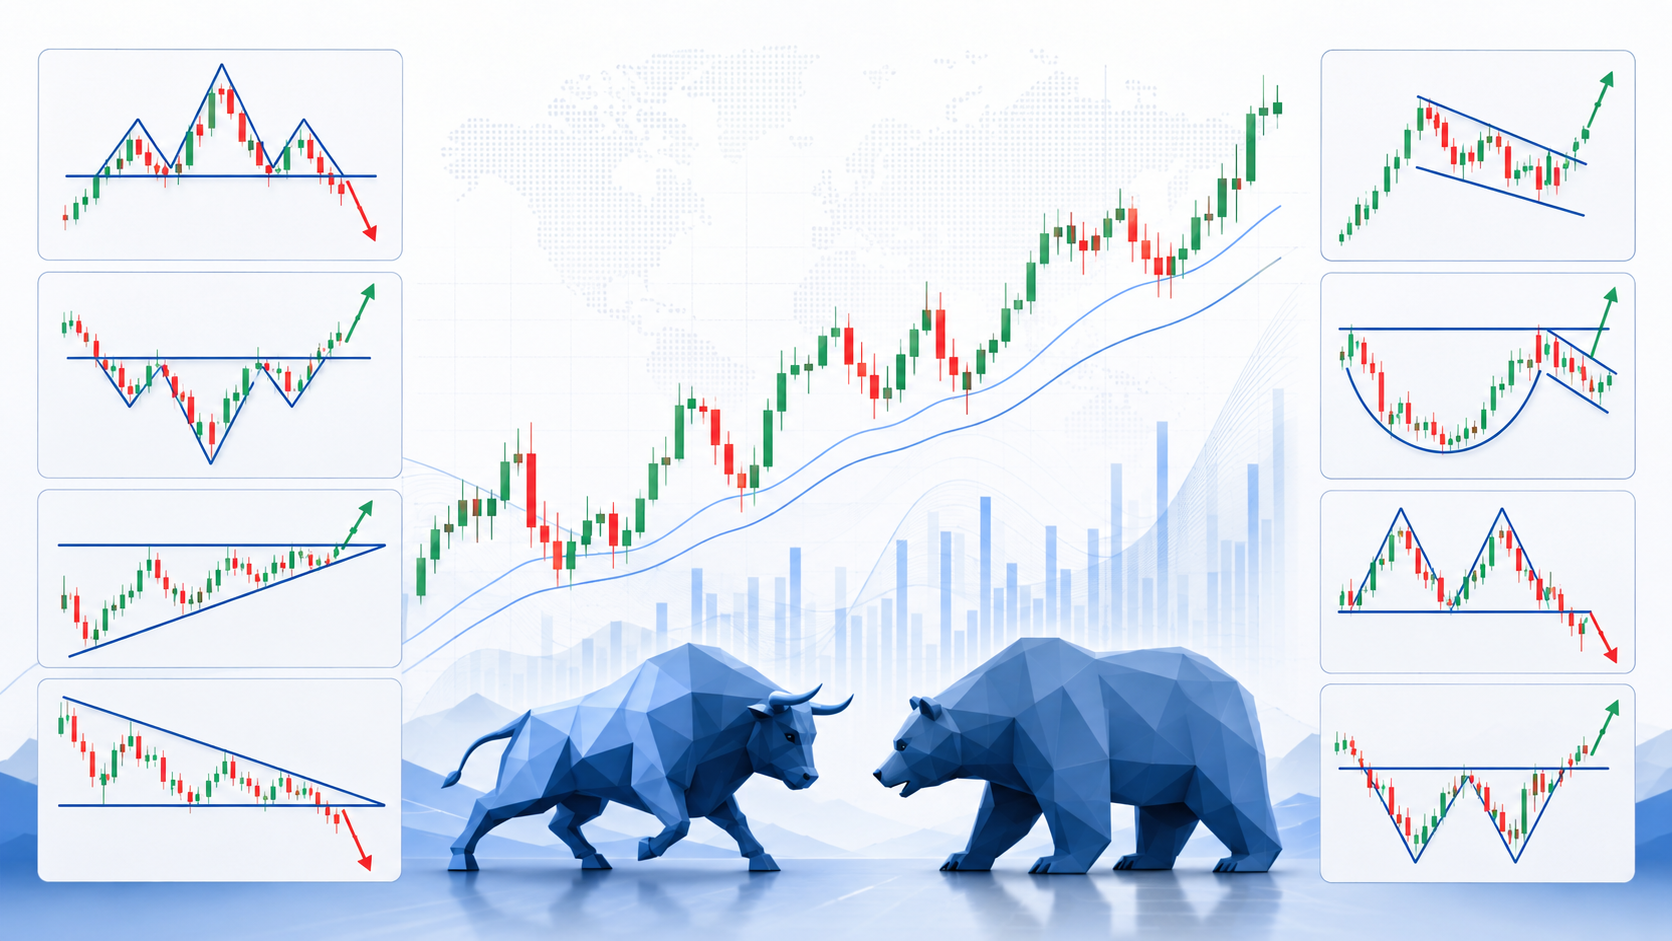
A professional approach is to combine Heikin Ashi with other technical tools. Moving averages can help identify the broader trend, momentum indicators such as RSI or MACD can confirm acceleration or weakening, and support and resistance levels can improve entry and exit timing. Volume is also important, because a trend supported by rising trading volume is often considered more reliable.
For example, when price is trading above a rising moving average, Heikin Ashi candles remain positive and have no lower wicks, and RSI is above 50 without being extremely overbought, the overall picture may indicate a stable uptrend. On the other hand, if candle bodies begin to shrink, wicks appear on both sides and MACD momentum weakens, the market may be approaching a correction or consolidation phase.
The main advantage of Heikin Ashi candles is visual clarity. They allow traders to quickly determine whether the market is rising, falling or moving without a clear direction. They are especially useful for trend-following strategies, swing trading and positions held for several days or weeks.
Their main disadvantage is lag. Because the candles are based on averages, a change in direction may appear later than it would on a traditional candlestick chart. During sideways markets, frequent color changes may also create misleading signals without any meaningful movement in price. For this reason, Heikin Ashi should not be used as a standalone trading system.
Heikin Ashi candles do not predict the future, but they help organize existing market information in a clearer way. They are particularly useful for traders who want to reduce market noise, identify trends and improve their ability to stay in profitable positions. The most effective approach is to use them alongside traditional candlesticks: Heikin Ashi for trend direction and momentum, and regular candles for precise decisions regarding entry price, stop-loss placement and profit targets.
Have a take on this?
Jump into the TradeTechAI Discord to discuss this article with other traders.
Written by
Admin User
Editor
Editor at TradeTechAI, covering market analysis, trading strategies, and portfolio insights.