One of the most interesting situations in technical analysis occurs when price and momentum indicators stop moving together. An index continues to climb, sometimes even to fresh record highs, while an indicator such as the RSI can no longer reproduce the strength seen during the previous advance.
This is where a divergence begins to appear.
A divergence does not mean the market will reverse tomorrow morning, and it is not a sell signal on its own. But it can be one of the earliest warnings that the price trend remains intact while the force behind that trend is beginning to weaken.
That is what makes the current picture across the three major U.S. indices — the S&P 500, Nasdaq 100 and Dow Jones — particularly interesting.
What Is a Bearish Divergence?
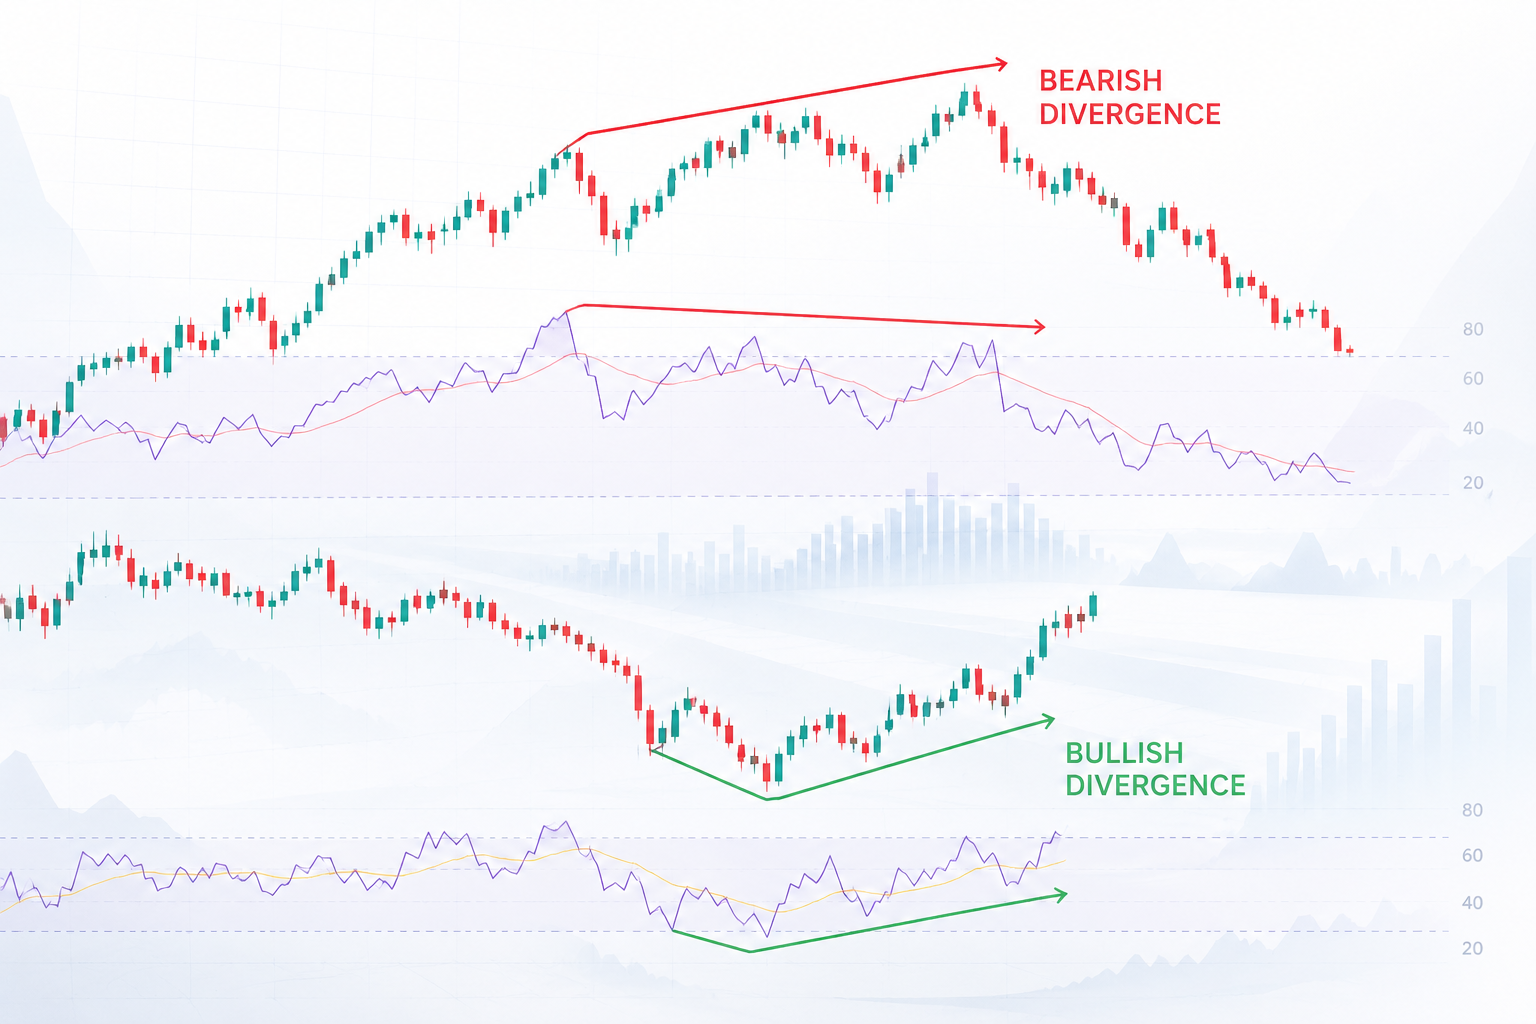
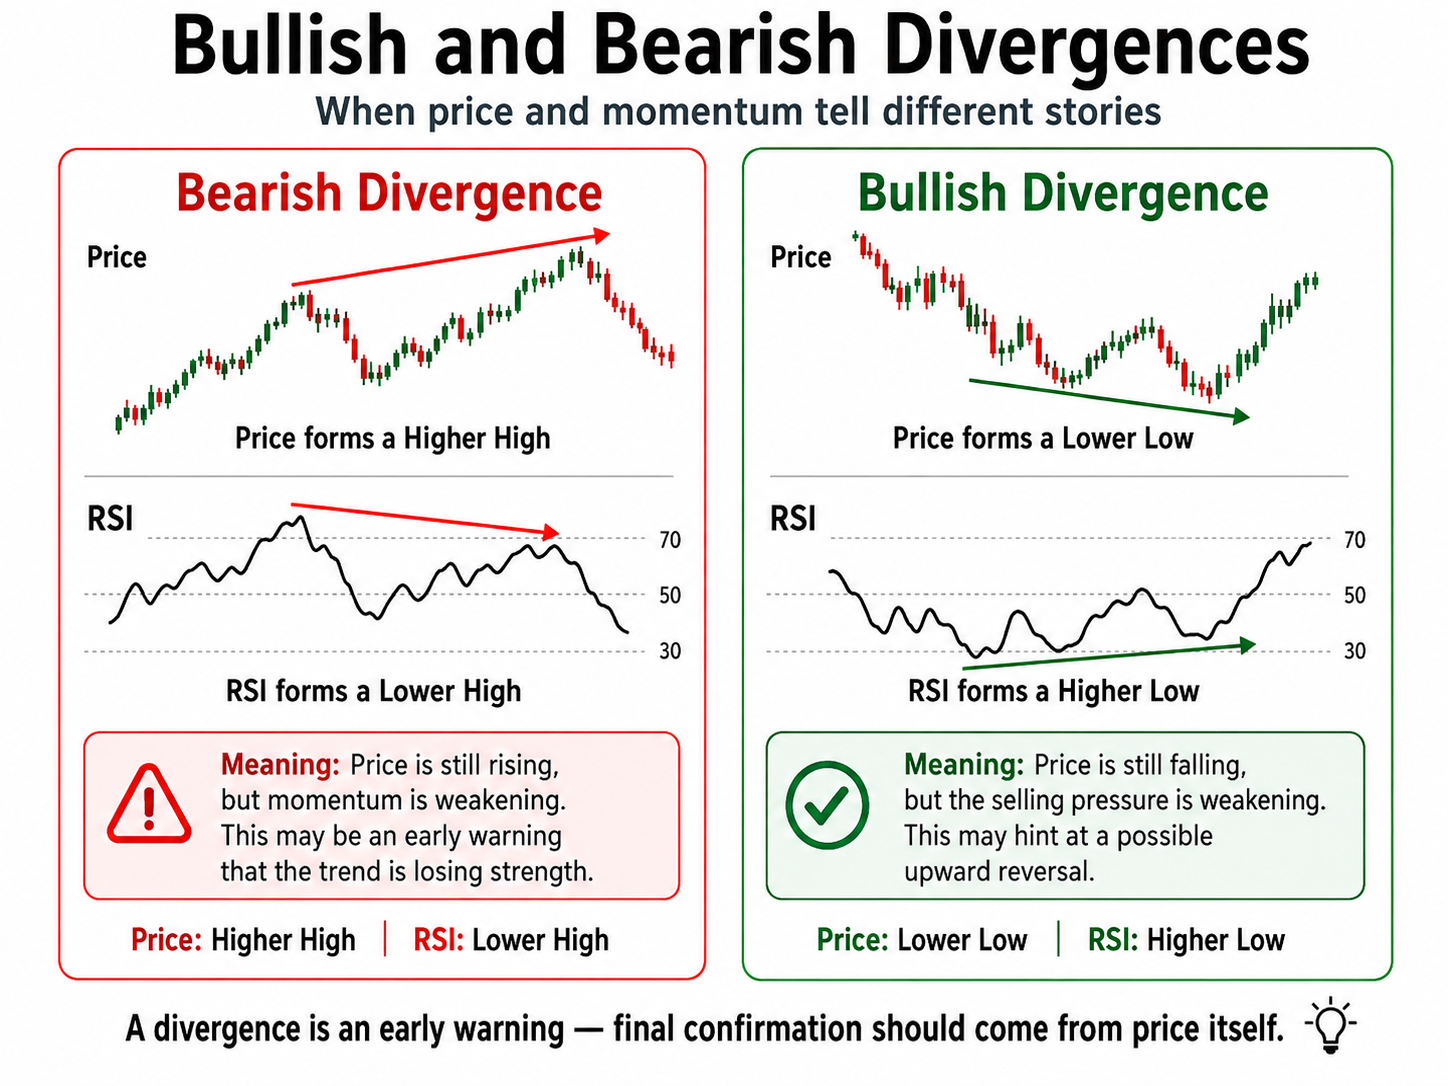
A bearish divergence occurs when price continues to make higher highs, while a momentum indicator makes lower highs.
In other words, the market is still rising, but each new rally is being achieved with less momentum.
Think of a car continuing to climb a hill while gradually losing speed. It is still moving forward, so the trend has not yet reversed, but the engine is no longer producing the same force.
With the RSI, for example, this occurs when the market reaches a new high while the RSI remains below the peak it reached during the previous advance.
The important point is that divergence measures a change in momentum, not necessarily a change in trend. An experienced investor therefore does not say, “There is a divergence, so I should sell.” The more useful question is:
Is price itself beginning to confirm the weakness that momentum is already showing?
What Is a Bullish Divergence?
The opposite situation occurs after a decline.
When price falls to a new low but the RSI produces a higher low, a bullish divergence is formed.
Price still appears weak, but selling pressure is beginning to lose strength.
Again, there is no guarantee that the market will immediately reverse higher. But the divergence can signal that sellers are losing control and that investors should begin watching for stabilization or a change in market structure.
The principle is therefore the same in both directions:
Divergence provides the warning — price must provide the confirmation.
The S&P 500 Is Where Things Get Interesting
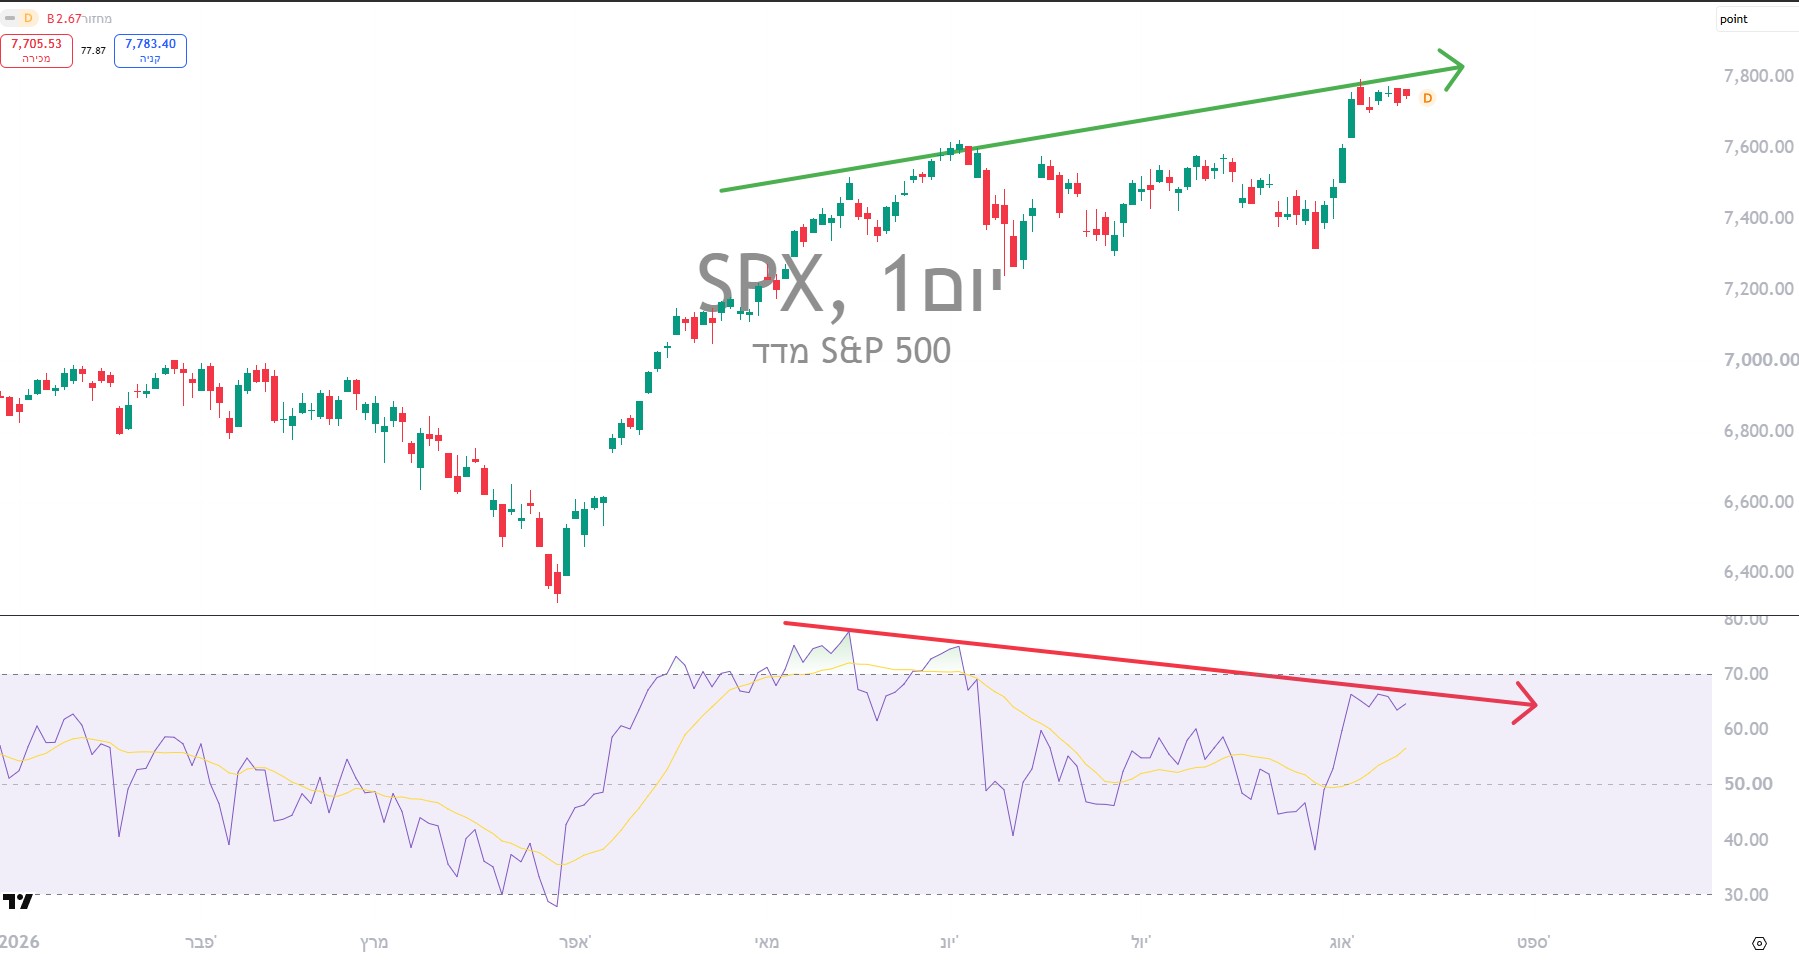
On the daily S&P 500 chart, the current picture is fairly clear.
The index has returned to the highs and is once again trading near record territory. Following the sharp decline in late March and early April, the index staged a powerful recovery and has continued to produce progressively higher highs.
Last week alone, the S&P 500 closed at a fresh record of 7,757.64.
But the picture changes when we look below price at the RSI.
During the May–June highs, the RSI reached the 70–80 area. When the index recently returned to record territory, however, the RSI remained lower, around the mid-to-upper 60s.
In simple terms:
Price — higher high.
RSI — lower high.
That is the textbook definition of a bearish divergence.
And what makes it especially interesting is that price itself still looks strong.
The S&P 500 is not currently in a downtrend. Quite the opposite: the price structure remains bullish, the index is near record highs, and it gained roughly 0.26% in the latest session following the U.S. inflation report.
But momentum is telling us that the current advance is not carrying the same force as previous rallies.
That is a warning sign — not a sell signal.
Nasdaq 100 — A Different Picture
This is perhaps the most interesting part of the comparison.
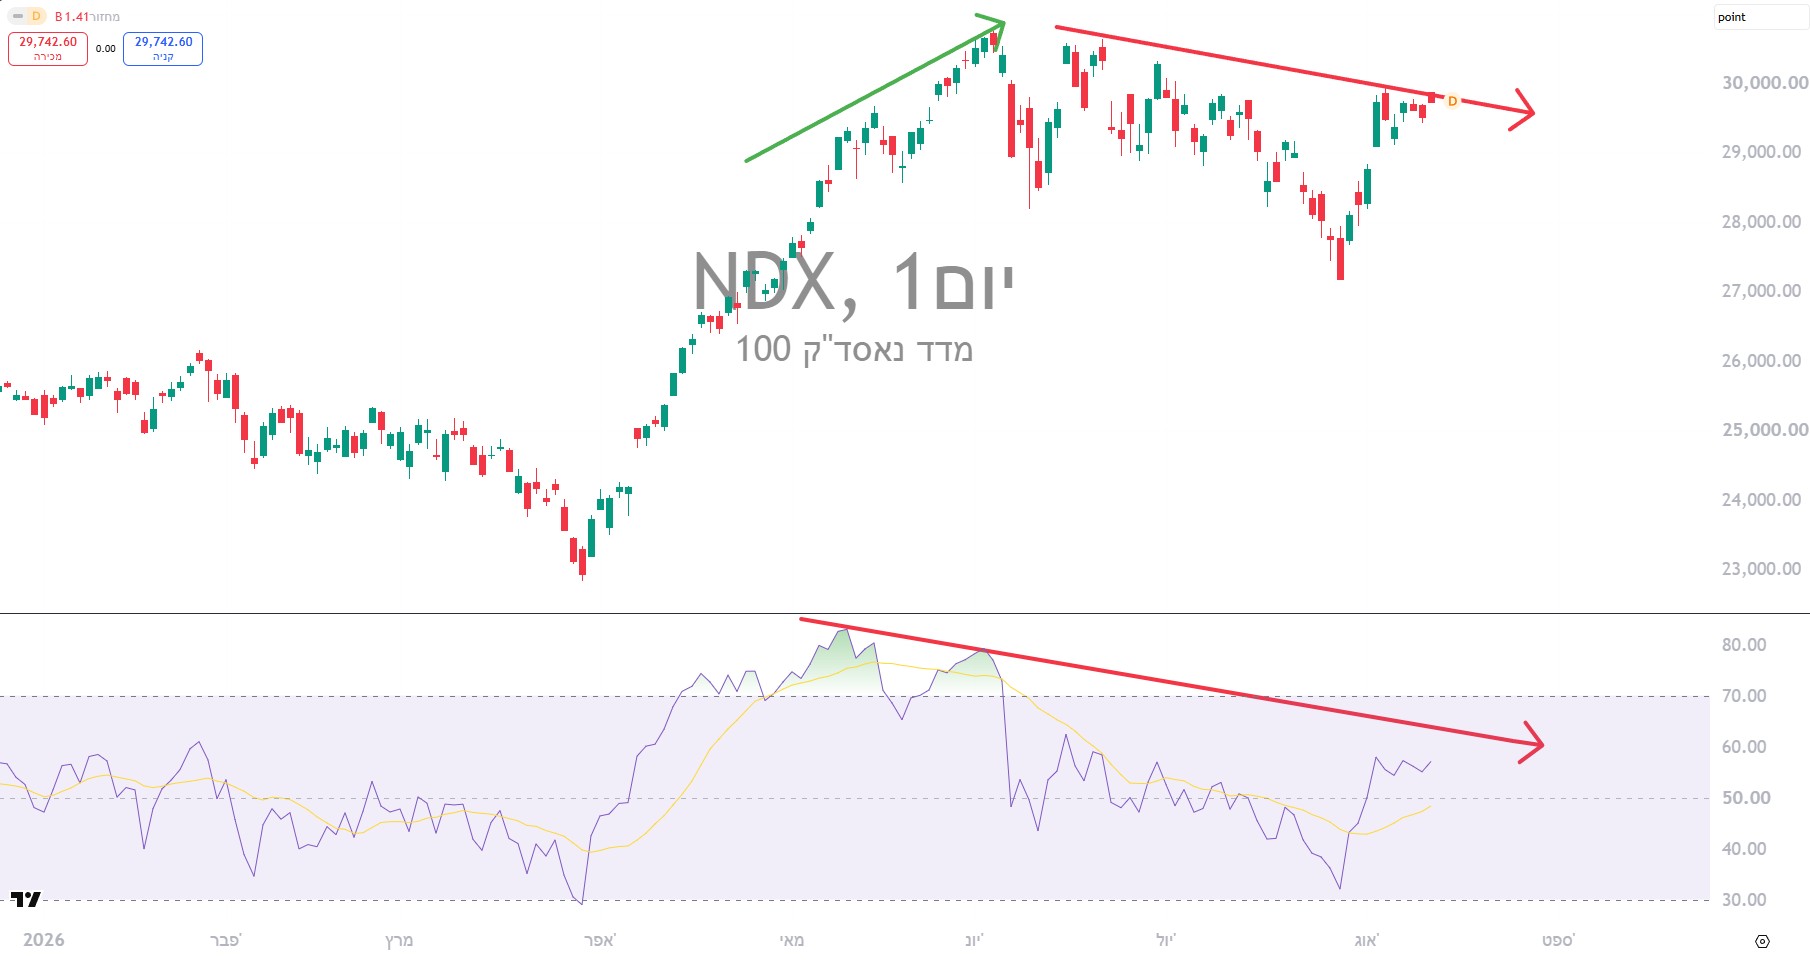
In the Nasdaq 100, we do not currently see the same classic bearish divergence that is visible in the S&P 500.
The NDX reached an important high earlier in the summer and then moved through a period of consolidation and correction. It has recovered strongly over the past month, but it has not yet produced a clean new price high above its previous peak.
At the same time, the RSI remains well below the extreme levels seen during May and June.
So there is clearly weaker momentum, but technically I would be cautious about calling it a fully confirmed bearish divergence.
To get a classic bearish divergence, we would want to see the NDX break to a new high while the RSI fails to confirm and forms a lower high.
That has not yet occurred cleanly on the current chart.
In fact, over the shorter term the Nasdaq RSI has recovered from the 30–40 area into the mid-50s, suggesting that short-term momentum is improving again.
This matters because technology and AI continue to be major engines of the broader market. In the latest session, technology and semiconductor stocks were once again among the main drivers of the advance, with the Nasdaq rising roughly 0.5%–0.7%.
So the Nasdaq picture can be summarized as follows:
There is no confirmed bearish divergence yet — but longer-term momentum is clearly weaker than it was during the previous rally.
If the NDX breaks to a new high while the RSI remains below its previous peaks, the bearish divergence would become much more convincing.
Dow Jones — Another Confirmation
The Dow presents another interesting setup.
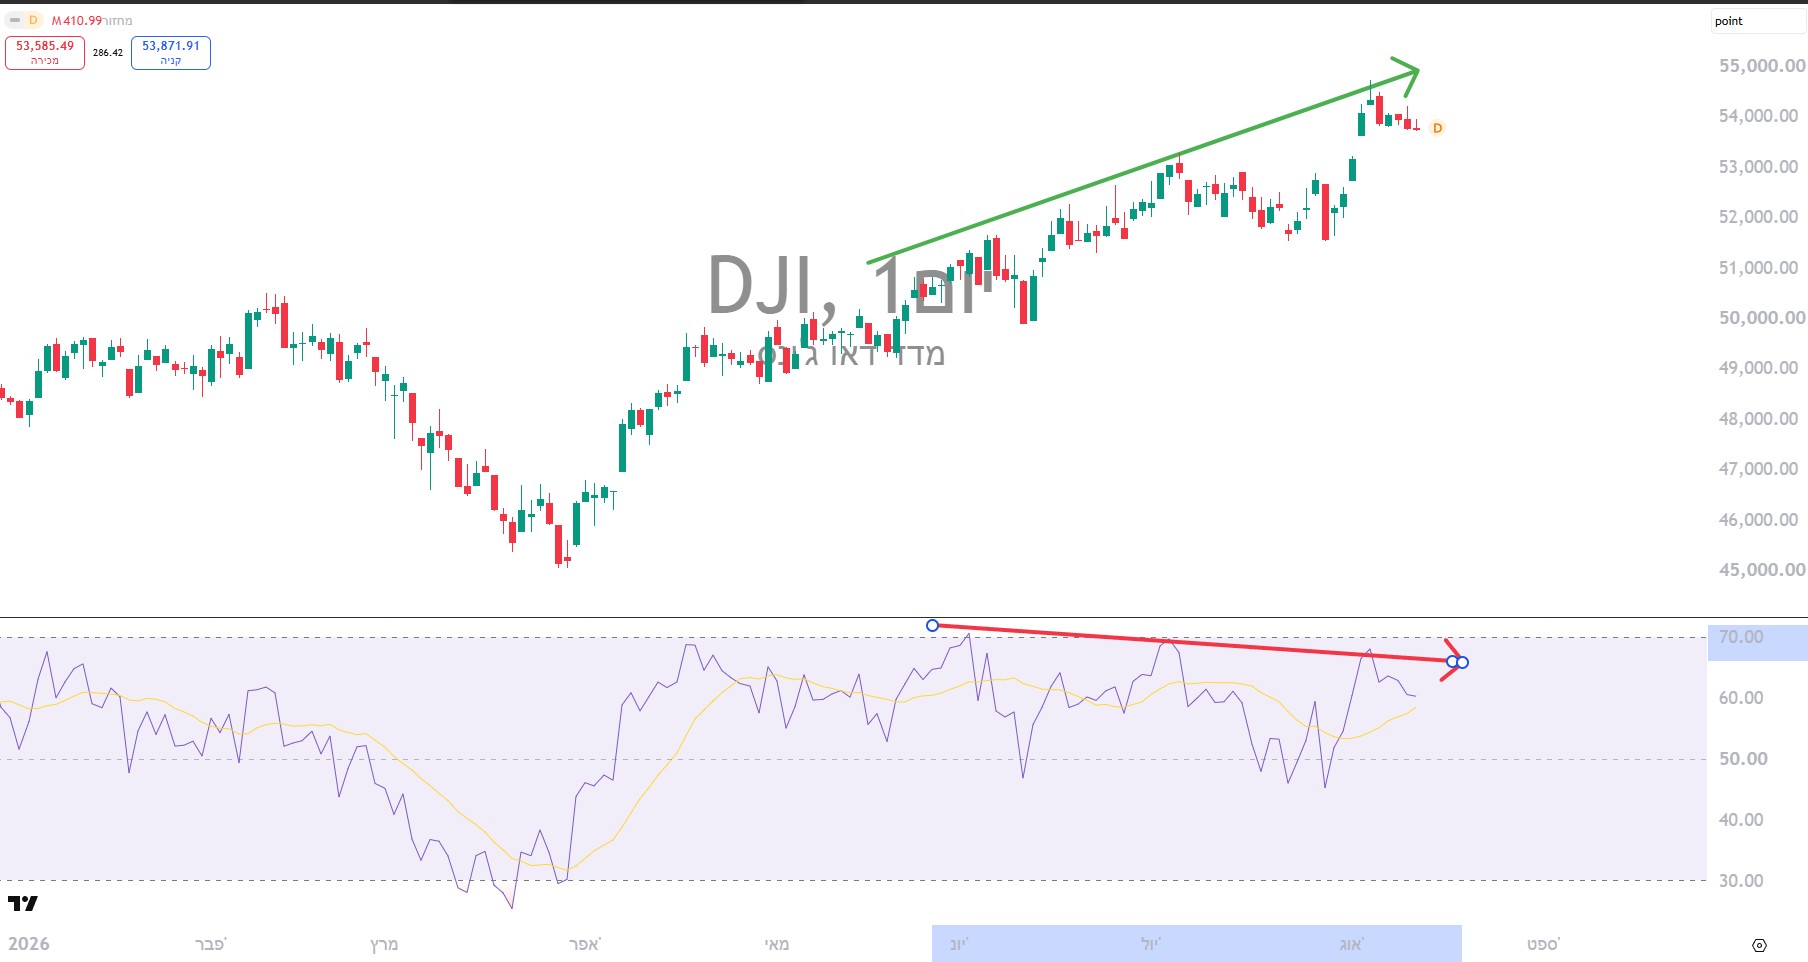
The index has recently pushed to new highs following a significant advance that carried it toward and above the 54,000 area. In early August, the Dow posted several consecutive record closes.
But just like the S&P 500, the RSI is not confirming the strength of the move.
The chart shows price continuing to make higher highs from June into August, while RSI peaks have gradually moved lower.
Once again, we have:
Rising price — falling momentum.
That means the Dow is also displaying a meaningful bearish divergence.
And that makes the broader market picture more important.
If the divergence existed only in the S&P 500, it could be treated as an isolated signal in one index.
But when both the S&P 500 and Dow are near new highs while their RSI readings fail to confirm the move, we are beginning to see a broader sign that market momentum is weakening beneath the surface.
Why Is the Nasdaq Different?
This is one of the key takeaways.
We are not seeing identical weakness across all three indices.
S&P 500 — clear bearish divergence.
Dow Jones — fairly clear bearish divergence.
Nasdaq 100 — weaker momentum, but no fully confirmed classic bearish divergence yet.
That means the market is not yet sending one unified warning signal.
And that distinction matters.
When all three major indices show bearish divergences at the same time, the message becomes far more significant. On the other hand, as long as technology maintains relatively stronger momentum, it can continue to support the broader indices even as other parts of the market begin to tire.
That was also visible in the latest session: the headline indices rose, but market breadth underneath the surface was weak. At one point, only 179 of the 500 stocks in the S&P 500 were higher, and only four of the 11 sectors were trading in positive territory.
That fits well with what the RSI is telling us.
The index itself looks strong — but not every part of the market is participating with the same intensity.
What Would Turn the Divergence Into a More Significant Signal?
This is where investors need to avoid the classic mistake of trying to call the exact market top.
A market can remain in a bearish divergence for a long time.
The RSI can continue to weaken while price keeps producing new highs.
That is why the most important confirmation must come from price itself.
The first warning would be a failure to make another high.
The second would be the formation of a lower high.
And the most important confirmation would be a break below the most recent significant swing low — in other words, a transition from a structure of Higher Highs and Higher Lows into one where Lower Highs and Lower Lows begin to appear.
Only then does the divergence move from being a theoretical warning to a signal that price itself is beginning to confirm.
Bottom Line
Wall Street remains in an uptrend, with the major indices trading near record highs. The latest inflation report also provided some support, as July CPI rose only 0.1% month over month and reduced some of the concern surrounding another Federal Reserve rate hike.
But beneath the surface, a picture is developing that deserves attention.
The S&P 500 and Dow are making higher highs while their RSI readings are making lower highs.
The Nasdaq is not yet providing the same confirmation, and that is currently one of the factors limiting the warning.
So there is no reason at this stage to conclude that the market is heading for a crash.
But there is certainly a reason to become more alert.
As long as price does not break down, the trend remains bullish. But if the Nasdaq joins the divergence and the S&P 500 and Dow begin to break important swing lows, the technical warning would become much more significant.
Have a take on this?
Jump into the TradeTechAI Discord to discuss this article with other traders.
Written by
Admin User
Editor
Editor at TradeTechAI, covering market analysis, trading strategies, and portfolio insights.